Clinical Experience Dashboard
The shortage of teachers continues to grow, and when indicators of teacher quality are taken into account the shortage is even more dire than estimated. Now more than ever we need programs to produce teachers who are highly-qualified and well-prepared—armed with the knowledge and skills to be effective in the classroom on day one. Access to connected data provides programs with a lens into candidates’ readiness to teach and informs improvements in candidate support and preparation.
To demonstrate the potential of the Ed-Fi Data Standard's educator preparation data model (EPDM), a sample PowerBI dashboard providing three visualizations: Evaluation, Evaluation Detail, and Survey.
The sample dashboards in the source code repository above were built for Ed-Fi Data Standard 4.0 and may require additional modification for newer versions of the Data Standard.
Evaluation
Evaluation User Story
As a user in a program administration personnel role, I want to view a summary of candidate ratings for the Teacher Work Sample evaluation by objective. The possible ratings that candidates can receive on this evaluation are Improvement Needed, Developing, and Proficient. I would like to see the percentage for each rating type by evaluation. I would also like to see a detailed view of the demographic distribution of candidates that were evaluated using the Teacher Work Sample evaluation.
Evaluation Report View
The Evaluation page includes 5 visuals. The 3 visuals on the left look at the number of evaluated candidates by race, sex, and certification status.
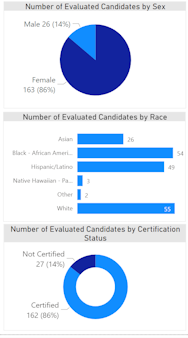
These 3 visuals also serve as filters for the entire Evaluation page. For example, clicking on Certified in the Number of Candidates by Certification Status highlights all of the other visuals on the page by showing the details of candidates that are certified.
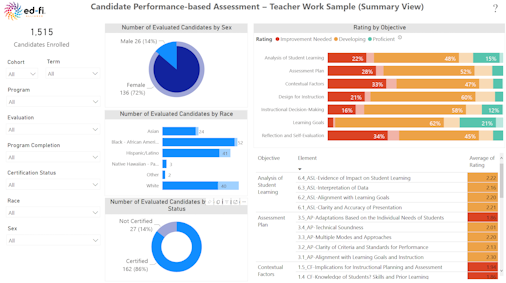
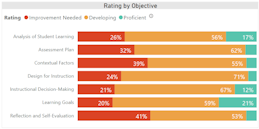
The visual on the top right (Rating by Objective) of the Evaluation page, shows the percentage of candidate evaluation ratings by objective. This visual can also be used as a filter for other visuals on the page. For example, clicking on the Improvement Needed rating within the visual, filters all visuals for this Rating.
Finally, the table visual on the bottom right of the Evaluation page, shows the average of Rating by Objective then by Element.

Evaluation Detail
Evaluation Detail User Story
As a program administrator, I want to see a summarized evaluation rating for all candidates as well as each candidate's rating by evaluation objectives and elements.
Evaluation Detail Report View
The Evaluation Detail page includes 2 visuals.
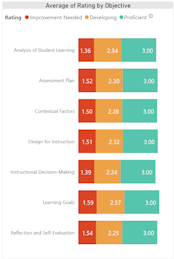
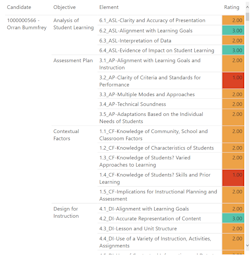
The visual on the left (Average of Rating by Objective) of the Evaluation Detail page, provides a summarized view of the average or Rating broken down by Rating description.
The visual on the right of the Evaluation Detail page provides a more detailed view of each candidate rating by Objective, then by Element. If there is more than one evaluation for that candidate, the average rating will be provided. Additionally, the Evaluation Date filter allows for viewing only those evaluations completed within a given timeframe. The Evaluation Detail page also includes a candidate filter that allows filtering for a specific candidate.
Survey
Survey User Story
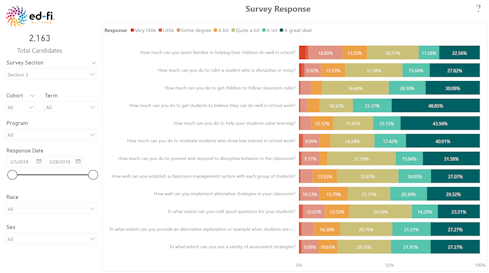
As a user in a program administration personnel role, I want to be able to view the summary of responses by candidates who completed a self-report survey (i.e., Completer/Exit Survey) to better understand their perceptions of the program experience. I also would like to be able to drill down by cohort, program, and demographic information.
Survey Report View
The Survey page includes 1 visual.
Unique filtering capabilities for this visual include section (portions within a survey or related survey questions) and response date (survey completion).
For implementation guidance, see the Clinical Experience and Performance Dashboard reference documentation.